当大多数人关注房地产市场时,通常会先看“刚刚成交了什么;。成交数据当然很重要,但它本质上是回顾性的。它告诉我们,买家和卖家在几天

Dated: November 25 2025
Views: 374
If you’ve been watching the Oklahoma City real estate market over the past few years, one thing is undeniable: home prices across Greater OKC have been on a steady, long-term climb. But not every city has grown at the same pace, and the real numbers tell a much more interesting story.
This week’s update breaks down two important perspectives:
Metro-wide price growth from 2019 through 2025
City-by-city appreciation across Greater OKC during the same period
When you combine both, you get one of the clearest pictures of long-term equity we’ve seen in our market.
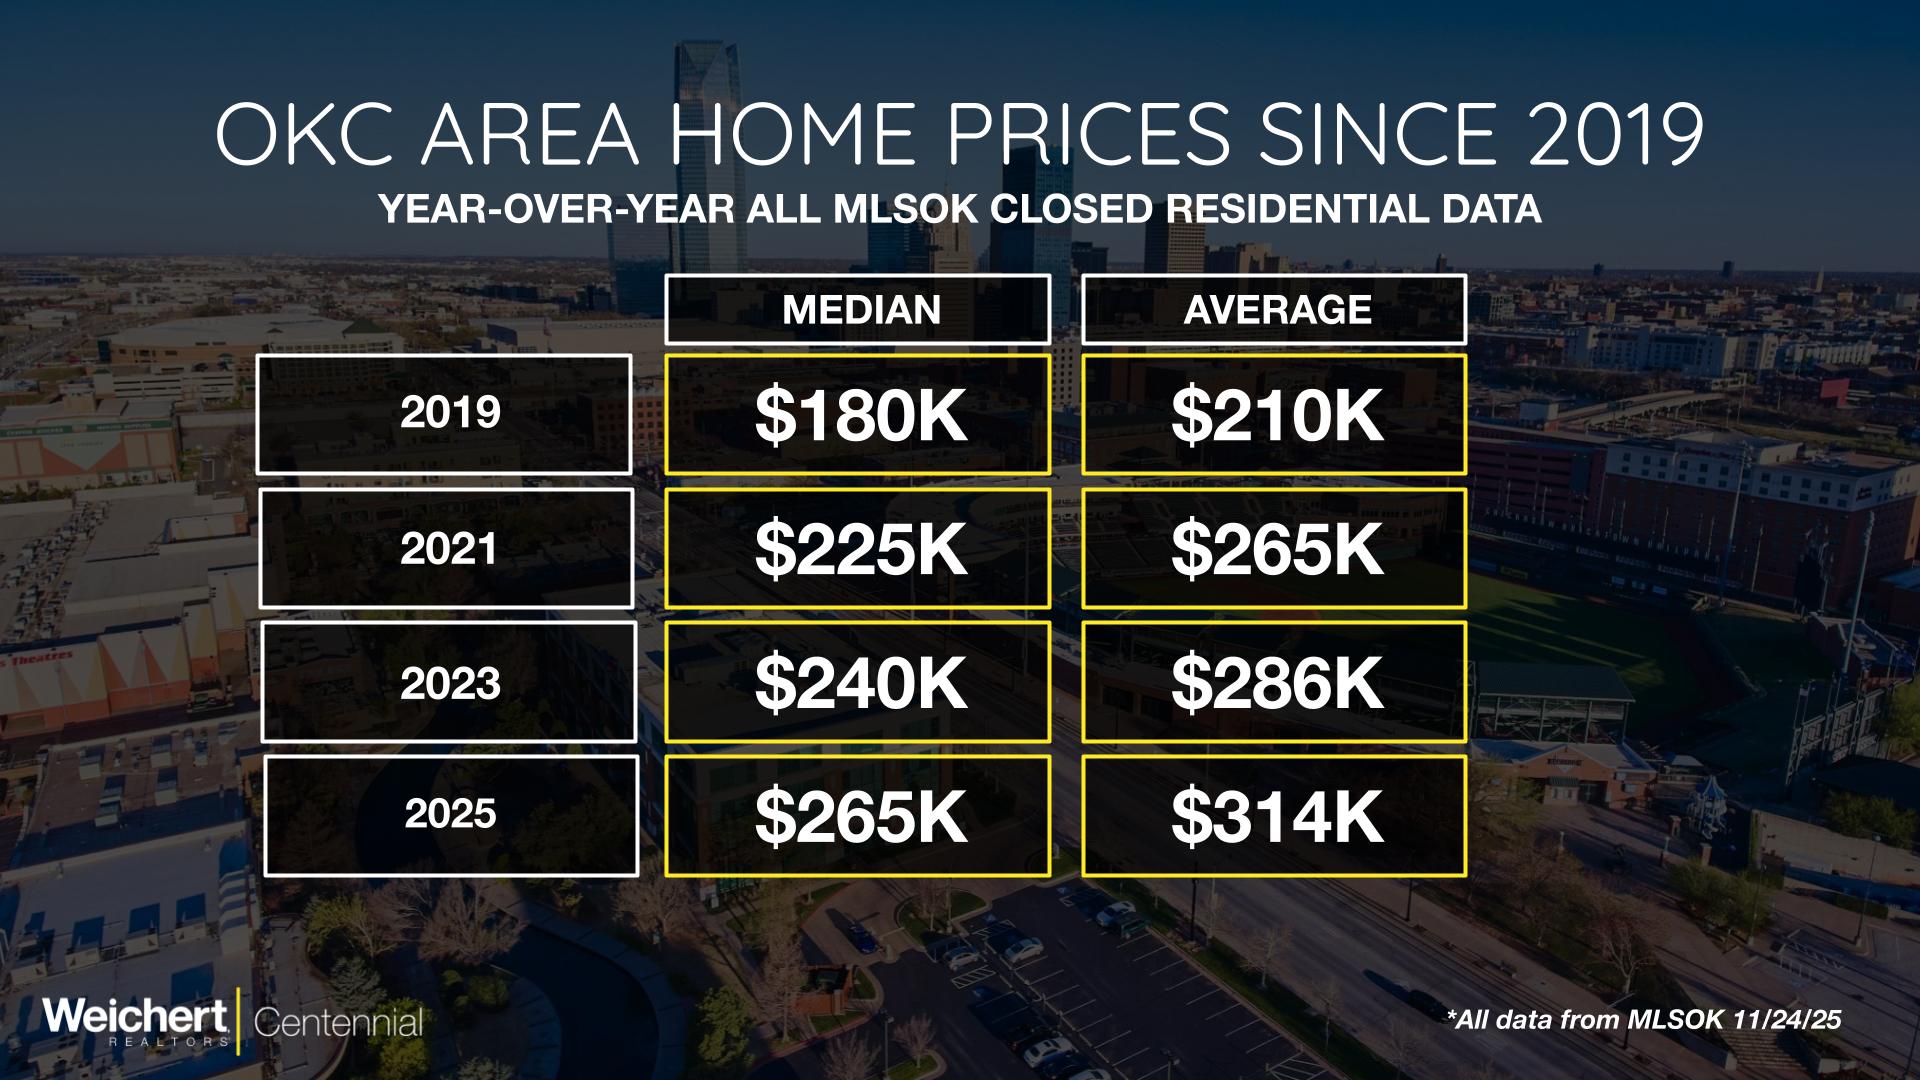
The first chart looks at all MLSOK closed residential data since 2019. And the headline is simple: Oklahoma City metro prices have risen steadily, year after year, without a single negative cycle in that timeframe.
2019: $180,000
2021: $225,000
2023: $240,000
2025: $265,000
That’s a 47% increase in median price in six years.
2019: $210,000
2021: $265,000
2023: $286,000
2025: $314,000
Average price has risen nearly $105,000 since 2019—a 50% gain.
This long-term trajectory matters for both buyers and sellers. For sellers, it means realistic equity growth, even if the market cools in any single year. For buyers, it illustrates why entering the market sooner—rather than waiting for the “perfect moment”—can have a major impact on long-term financial outcomes.
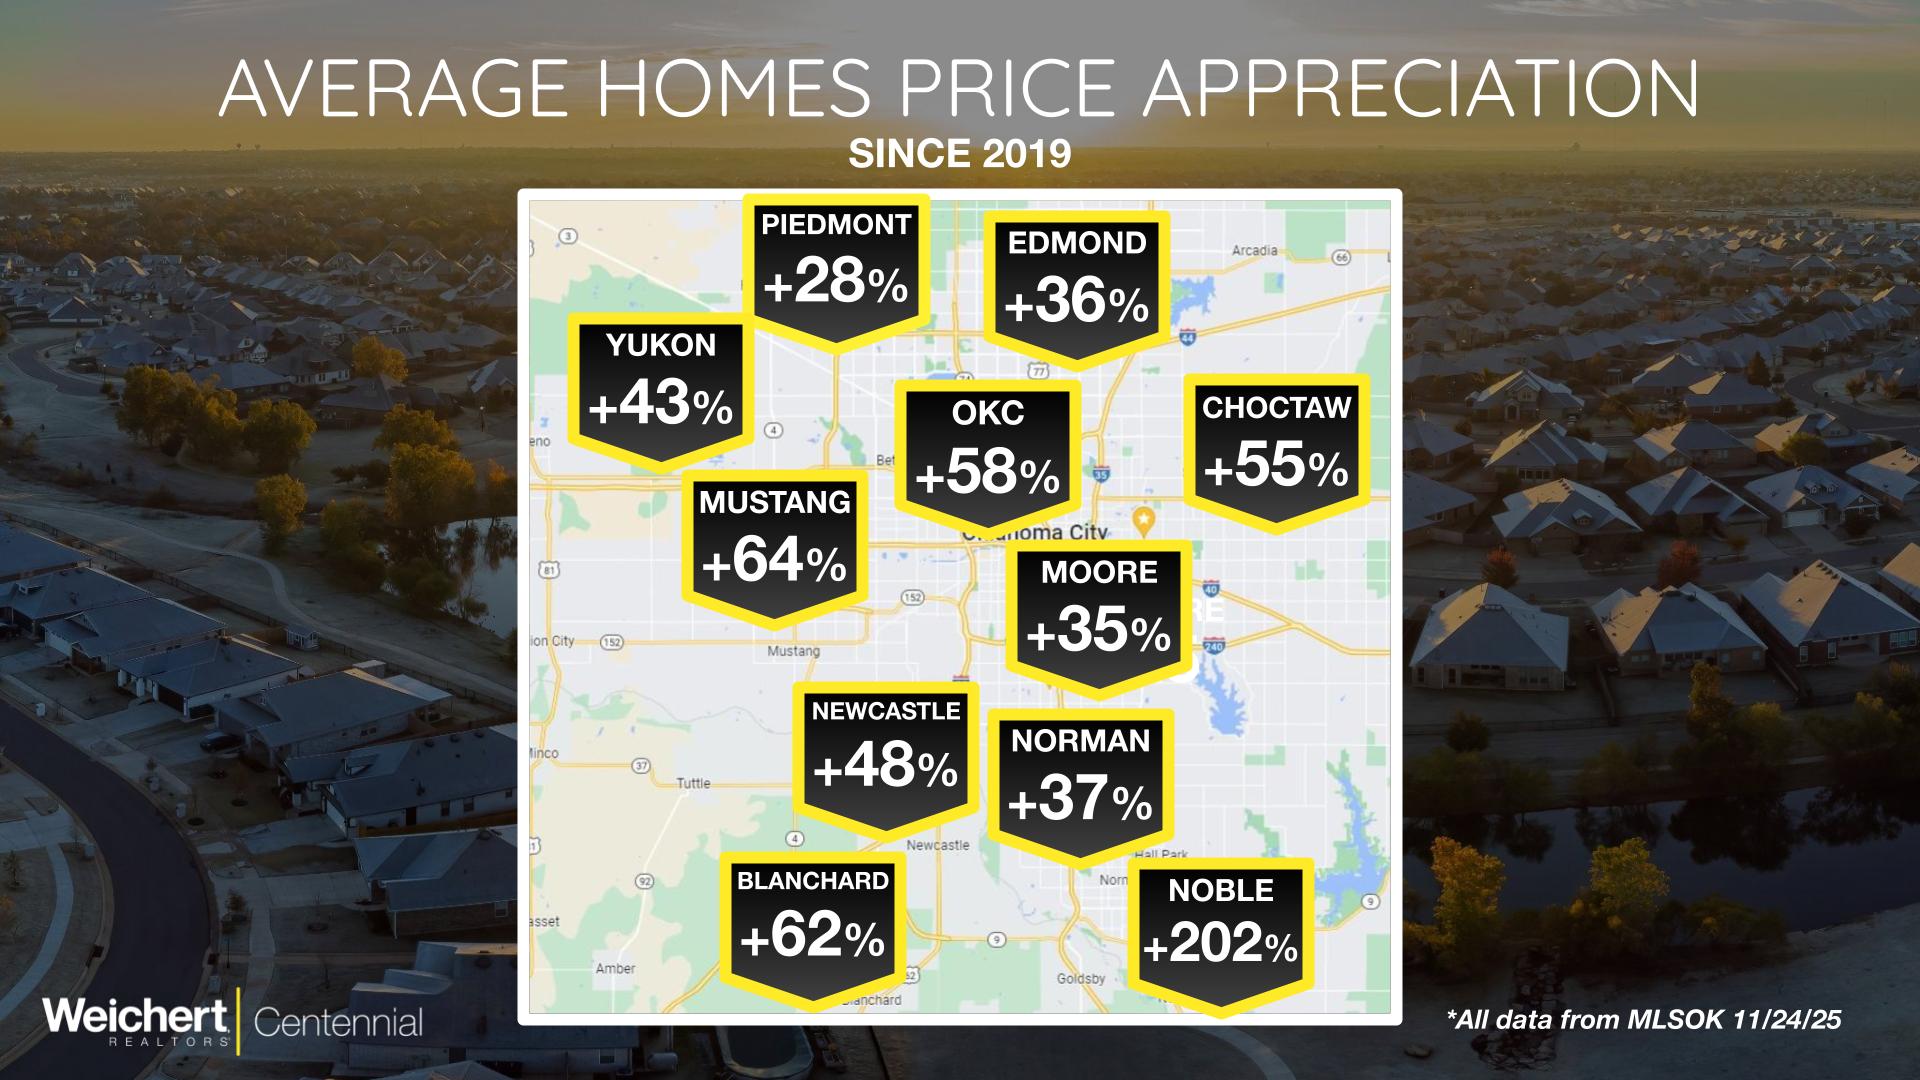
The second chart breaks down local appreciation by city across Greater OKC since 2019. And this is where the data gets especially interesting.
Here are the highlights:
Noble: +202%
Yes, it’s real—but highly influenced by small sample size and a shift in the mix of homes sold. Still, the trend direction matches the rest of the metro.
Mustang: +64%
A fast-growing area with strong new construction and steady demand.
Blanchard: +62%
Rural-to-suburban migration has pushed sustained value growth here.
Oklahoma City (Core): +58%
The city continues to be affordable relative to national markets, driving both owner-occupant and investor demand.
Choctaw: +55%
Consistent appreciation supported by schools, lot sizes, and steady turnover.
Newcastle: +48%
Momentum from new development and proximity to major highways.
Yukon: +43%
These cities started from higher baseline prices, so gains are naturally less extreme.
Piedmont: +28%
No city posted negative long-term appreciation. Every major submarket across Greater OKC saw multi-year price gains.
A few major takeaways stand out:
There were no “boom-and-bust” cycles in this dataset, despite interest rate fluctuations and national economic swings.
Cities with historically more affordable housing posted the highest appreciation percentages.
From OKC proper to Blanchard to Choctaw, nearly the entire metro benefited.
This reinforces the idea that waiting for perfect timing rarely beats long-term ownership.
The Oklahoma City housing market has shown stable, sustained appreciation across every major city since 2019. Whether you're a buyer trying to understand long-term value, a seller curious about your equity, or an investor watching trends—this data paints a clear picture.
And as always, the smartest decisions start with understanding the numbers.
If you'd like a city-specific breakdown, a custom home-value estimate, or a neighborhood-level appreciation report, I can put that together anytime.

Real estate is more than just buying and selling homes—it’s about helping people move forward in life. I pride myself on being a good listener and lifelong learner, always focused on under....
When most people look at the housing market, they focus on what just sold.Closed sales are useful, but they are also backward-looking. They tell us what buyers and sellers agreed to days or weeks.
One of the easiest ways to misunderstand the housing market is to look at one number and assume it tells the whole story.That is especially true with average sales price.The latest MLSOK data shows
 Copyright© 2026 MLSOK, Inc. listing content is believed to be accurate but is not guaranteed. Subject to verification by all parties. The listing information being provided is for consumers personal, non?commercial use and may not be used for any purpose other than to identify prospective properties consumers may be interested in purchasing. This listing data is copyrighted and may not be transmitted, retransmitted, copied, framed, repurposed, or altered in any way for any other site, individual
and/or purpose without the express written permission of MLSOK, Inc. Information last updated on September 22, 2026 5:26 PM UTC
© 2026 OKC Metropolitan Association of REALTORS® (OKMAR). All rights reserved.
Disclaimer: All information deemed reliable but not guaranteed and should be independently verified. All properties are subject to prior sale, change or withdrawal. Neither listing broker(s) nor September 22, 2026 5:26 PM UTC shall be responsible for any typographical errors, misinformation, misprints and shall be held totally harmless.
Data last updated on September 22, 2026 5:26 PM UTC
Show More...
Copyright© 2026 MLSOK, Inc. listing content is believed to be accurate but is not guaranteed. Subject to verification by all parties. The listing information being provided is for consumers personal, non?commercial use and may not be used for any purpose other than to identify prospective properties consumers may be interested in purchasing. This listing data is copyrighted and may not be transmitted, retransmitted, copied, framed, repurposed, or altered in any way for any other site, individual
and/or purpose without the express written permission of MLSOK, Inc. Information last updated on September 22, 2026 5:26 PM UTC
© 2026 OKC Metropolitan Association of REALTORS® (OKMAR). All rights reserved.
Disclaimer: All information deemed reliable but not guaranteed and should be independently verified. All properties are subject to prior sale, change or withdrawal. Neither listing broker(s) nor September 22, 2026 5:26 PM UTC shall be responsible for any typographical errors, misinformation, misprints and shall be held totally harmless.
Data last updated on September 22, 2026 5:26 PM UTC
Show More...
