当大多数人关注房地产市场时,通常会先看“刚刚成交了什么;。成交数据当然很重要,但它本质上是回顾性的。它告诉我们,买家和卖家在几天

Dated: March 19 2026
Views: 25
One of the easiest mistakes people make when reading housing market data is assuming that past appreciation tells you everything you need to know about the market right now. It does not.
The two graphs here are a great example of why. One shows average home appreciation across the OKC metro since 2021. The other shows average seller concessions on residential properties closed in the last 45 days. When you put those two side by side, the takeaway is clear: a city can build a lot of long-term value and still require sellers to give up money today in order to get a deal done.
That may sound contradictory, but it is actually one of the most important truths in real estate.
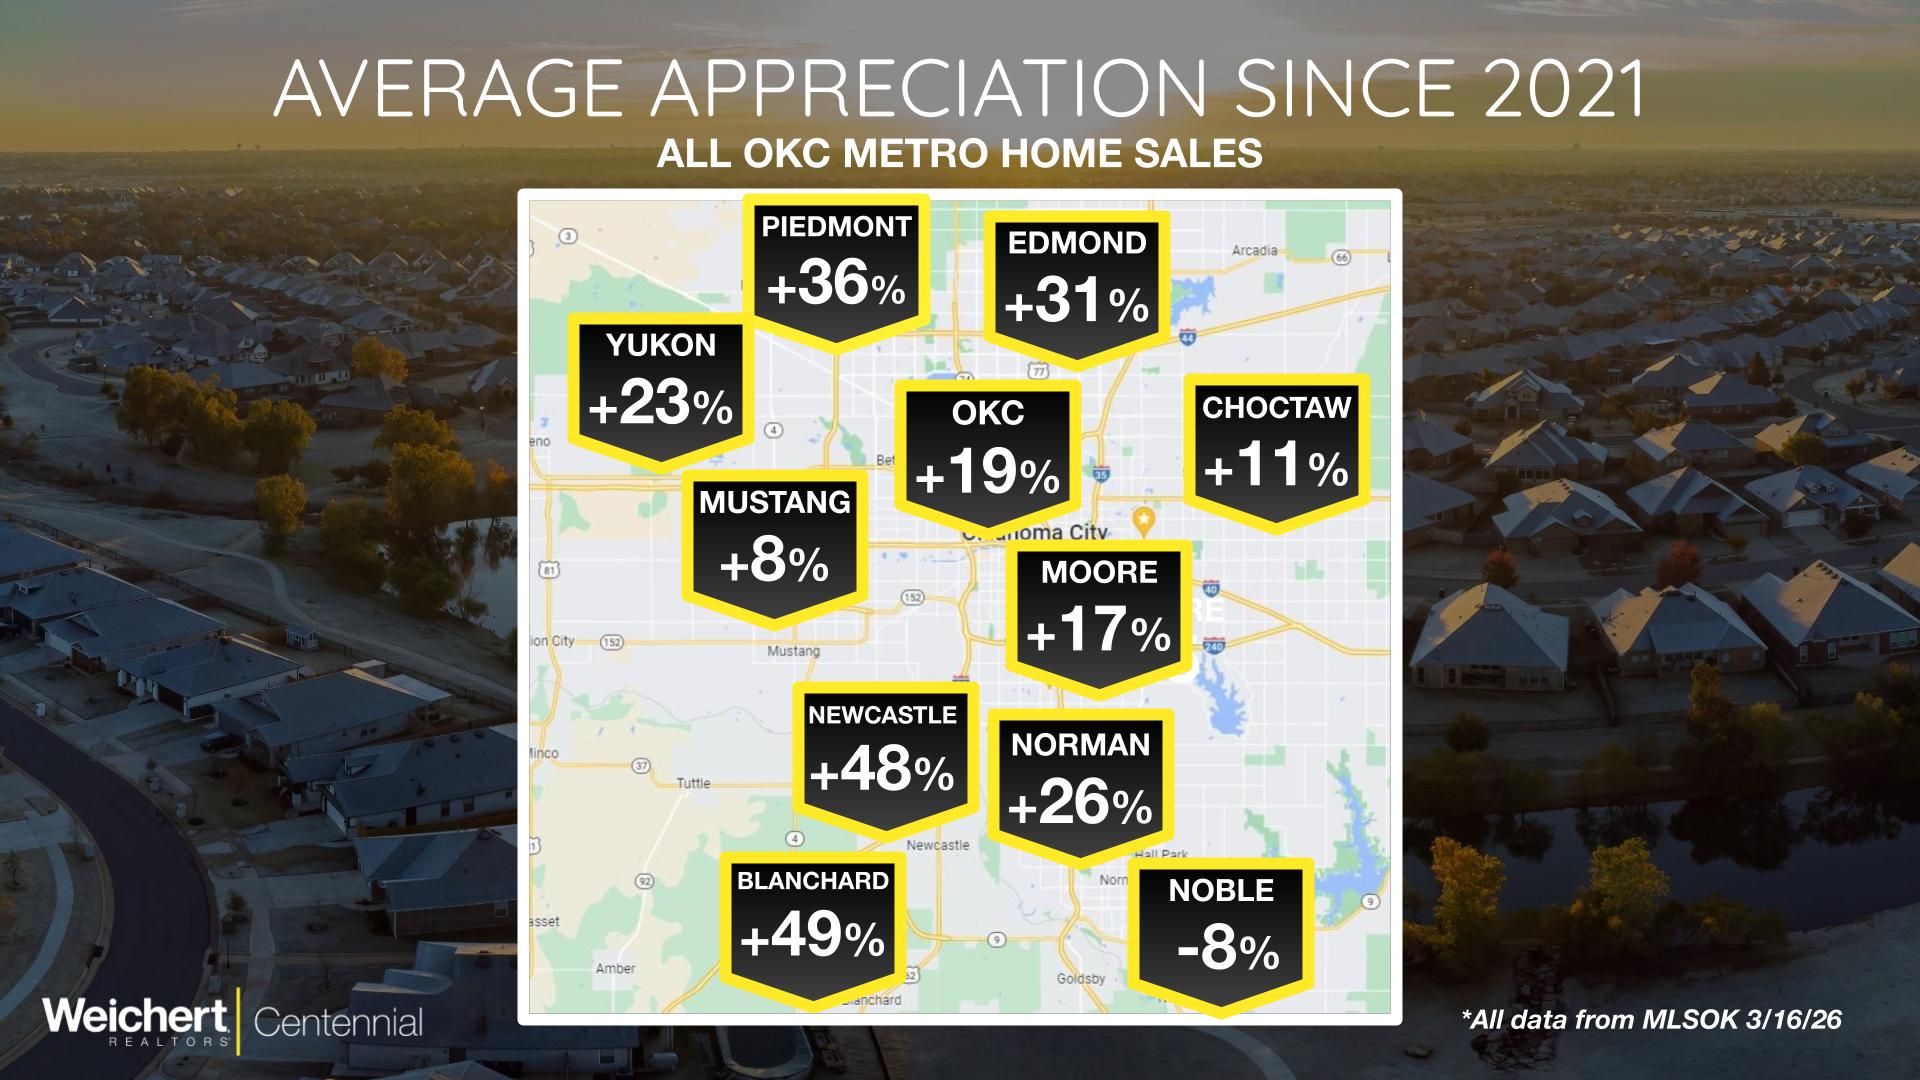
The appreciation map shows how much prices have climbed in each area since 2021. Some cities have seen substantial gains.
Blanchard and Newcastle stand out the most, both pushing close to 50% appreciation. Piedmont is also very strong at 36%, with Edmond at 31% and Norman at 26%. Even OKC and Yukon have posted healthy gains, while Mustang and Choctaw are more modest.
The point of this graph is not just to celebrate growth. It shows where homeowners have likely built the most equity over the last several years. For sellers, that can be a major advantage. It can create flexibility, profit, and confidence when entering the market.
But equity growth is only one side of the story.
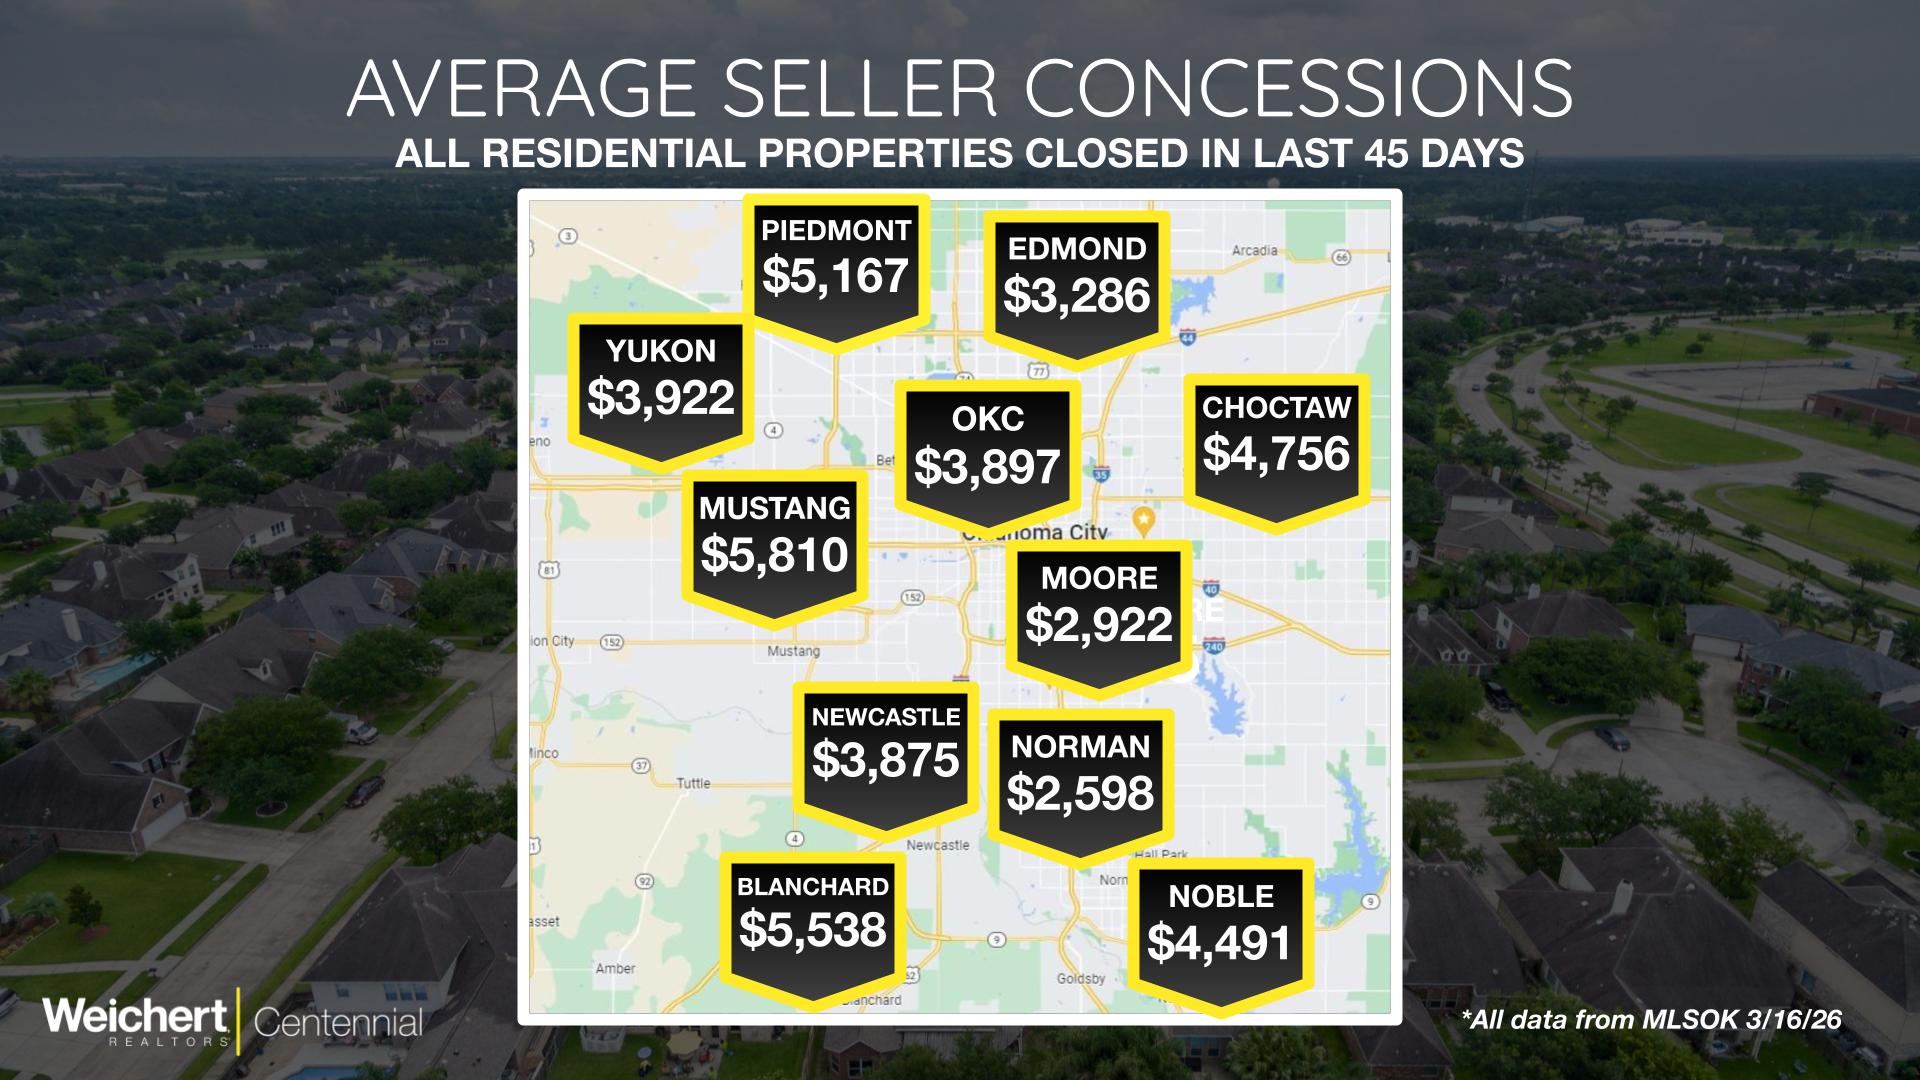
The second graph shows what sellers are currently giving up in the market to make deals work. These concessions can include closing costs, repairs, rate buydowns, or other credits that reduce the buyer’s total out-of-pocket burden.
This is where the market gets more interesting.
Some of the highest concession numbers are showing up in places like:
Meanwhile, places like Norman and Moore are noticeably lower, at $2,598 and $2,922 respectively.
That means sellers in some high-appreciation areas are still having to negotiate aggressively on the back end of the deal.
At first glance, that seems strange. If a city appreciated so much, shouldn’t sellers have more leverage?
Not necessarily.
Appreciation is a backward-looking number. It tells you how much value has accumulated over time. Seller concessions are a current market behavior metric. They tell you what buyers are demanding right now.
A market can have strong long-term appreciation and still face:
More competition from current listings
More price sensitivity from buyers
Higher financing pressure due to monthly payment concerns
More selective buyers expecting help with closing costs or rate buydowns
This is especially important in a market like the OKC metro, where conditions are increasingly hyper-local.
For example, Blanchard has appreciated strongly since 2021, but sellers are still averaging over $5,500 in concessions right now. That does not erase the value growth. It just means buyers currently have enough leverage to negotiate more aggressively.
If you are a homeowner thinking about selling, the lesson is simple: do not rely only on your appreciation story.
Yes, long-term gains matter. They may give you more equity and flexibility. But buyers are shopping in today’s market, not in 2021’s market.
That means:
Your pricing still has to reflect current competition
Your presentation still has to be strong
And your strategy has to account for concessions, not just list price
The sellers getting the best outcomes right now are not just the ones sitting on appreciation. They are the ones who understand how today’s buyers are behaving.
For buyers, these charts are encouraging.
They show that even in areas with strong long-term value growth, there may still be room to negotiate. That does not always mean a lower price. In many cases, it means asking for closing costs, repairs, or other financial help that improves affordability.
That is a big deal in a market where monthly payment matters as much as headline price.
The big takeaway from these two graphs is this: past appreciation and present leverage are not the same thing.
A city may have built tremendous value since 2021 and still be a place where sellers are giving ground today. That is not a contradiction. It is simply the difference between what the market has done over time and what it is doing right now.
For anyone buying or selling in the OKC metro, that distinction matters. The smartest decisions come from understanding both.
Because in real estate, the best strategy is never built on one number alone.

Real estate is more than just buying and selling homes—it’s about helping people move forward in life. I pride myself on being a good listener and lifelong learner, always focused on under....
When most people look at the housing market, they focus on what just sold.Closed sales are useful, but they are also backward-looking. They tell us what buyers and sellers agreed to days or weeks.
One of the easiest ways to misunderstand the housing market is to look at one number and assume it tells the whole story.That is especially true with average sales price.The latest MLSOK data shows
 Copyright© 2026 MLSOK, Inc. listing content is believed to be accurate but is not guaranteed. Subject to verification by all parties. The listing information being provided is for consumers personal, non?commercial use and may not be used for any purpose other than to identify prospective properties consumers may be interested in purchasing. This listing data is copyrighted and may not be transmitted, retransmitted, copied, framed, repurposed, or altered in any way for any other site, individual
and/or purpose without the express written permission of MLSOK, Inc. Information last updated on September 22, 2026 5:26 PM UTC
© 2026 OKC Metropolitan Association of REALTORS® (OKMAR). All rights reserved.
Disclaimer: All information deemed reliable but not guaranteed and should be independently verified. All properties are subject to prior sale, change or withdrawal. Neither listing broker(s) nor September 22, 2026 5:26 PM UTC shall be responsible for any typographical errors, misinformation, misprints and shall be held totally harmless.
Data last updated on September 22, 2026 5:26 PM UTC
Show More...
Copyright© 2026 MLSOK, Inc. listing content is believed to be accurate but is not guaranteed. Subject to verification by all parties. The listing information being provided is for consumers personal, non?commercial use and may not be used for any purpose other than to identify prospective properties consumers may be interested in purchasing. This listing data is copyrighted and may not be transmitted, retransmitted, copied, framed, repurposed, or altered in any way for any other site, individual
and/or purpose without the express written permission of MLSOK, Inc. Information last updated on September 22, 2026 5:26 PM UTC
© 2026 OKC Metropolitan Association of REALTORS® (OKMAR). All rights reserved.
Disclaimer: All information deemed reliable but not guaranteed and should be independently verified. All properties are subject to prior sale, change or withdrawal. Neither listing broker(s) nor September 22, 2026 5:26 PM UTC shall be responsible for any typographical errors, misinformation, misprints and shall be held totally harmless.
Data last updated on September 22, 2026 5:26 PM UTC
Show More...
