At first glance, the latest MLSOK numbers make the market look remarkably strong for sellers.Across nearly every featured OKC-area town, homes are selling for an average of 98% to 100% of list.

Dated: January 31 2026
Views: 54
If you’ve been watching the Oklahoma City metro real estate market lately, you’ve probably heard the phrase “seller concessions” more than you did a couple years ago. It sounds simple: a seller gives money or credits to the buyer to help make the deal work. But the reality is more nuanced — and the three graphs you shared tell a bigger story than “buyers are winning” or “sellers are desperate.”
Seller concessions are best understood as a pressure gauge. They show where the market is tight, where it’s loosening, and how pricing strategy is evolving. When you look at the dollar amounts, the percentage of sales price, and the recent change trend, you can see exactly how leverage is shifting across the OKC metro.
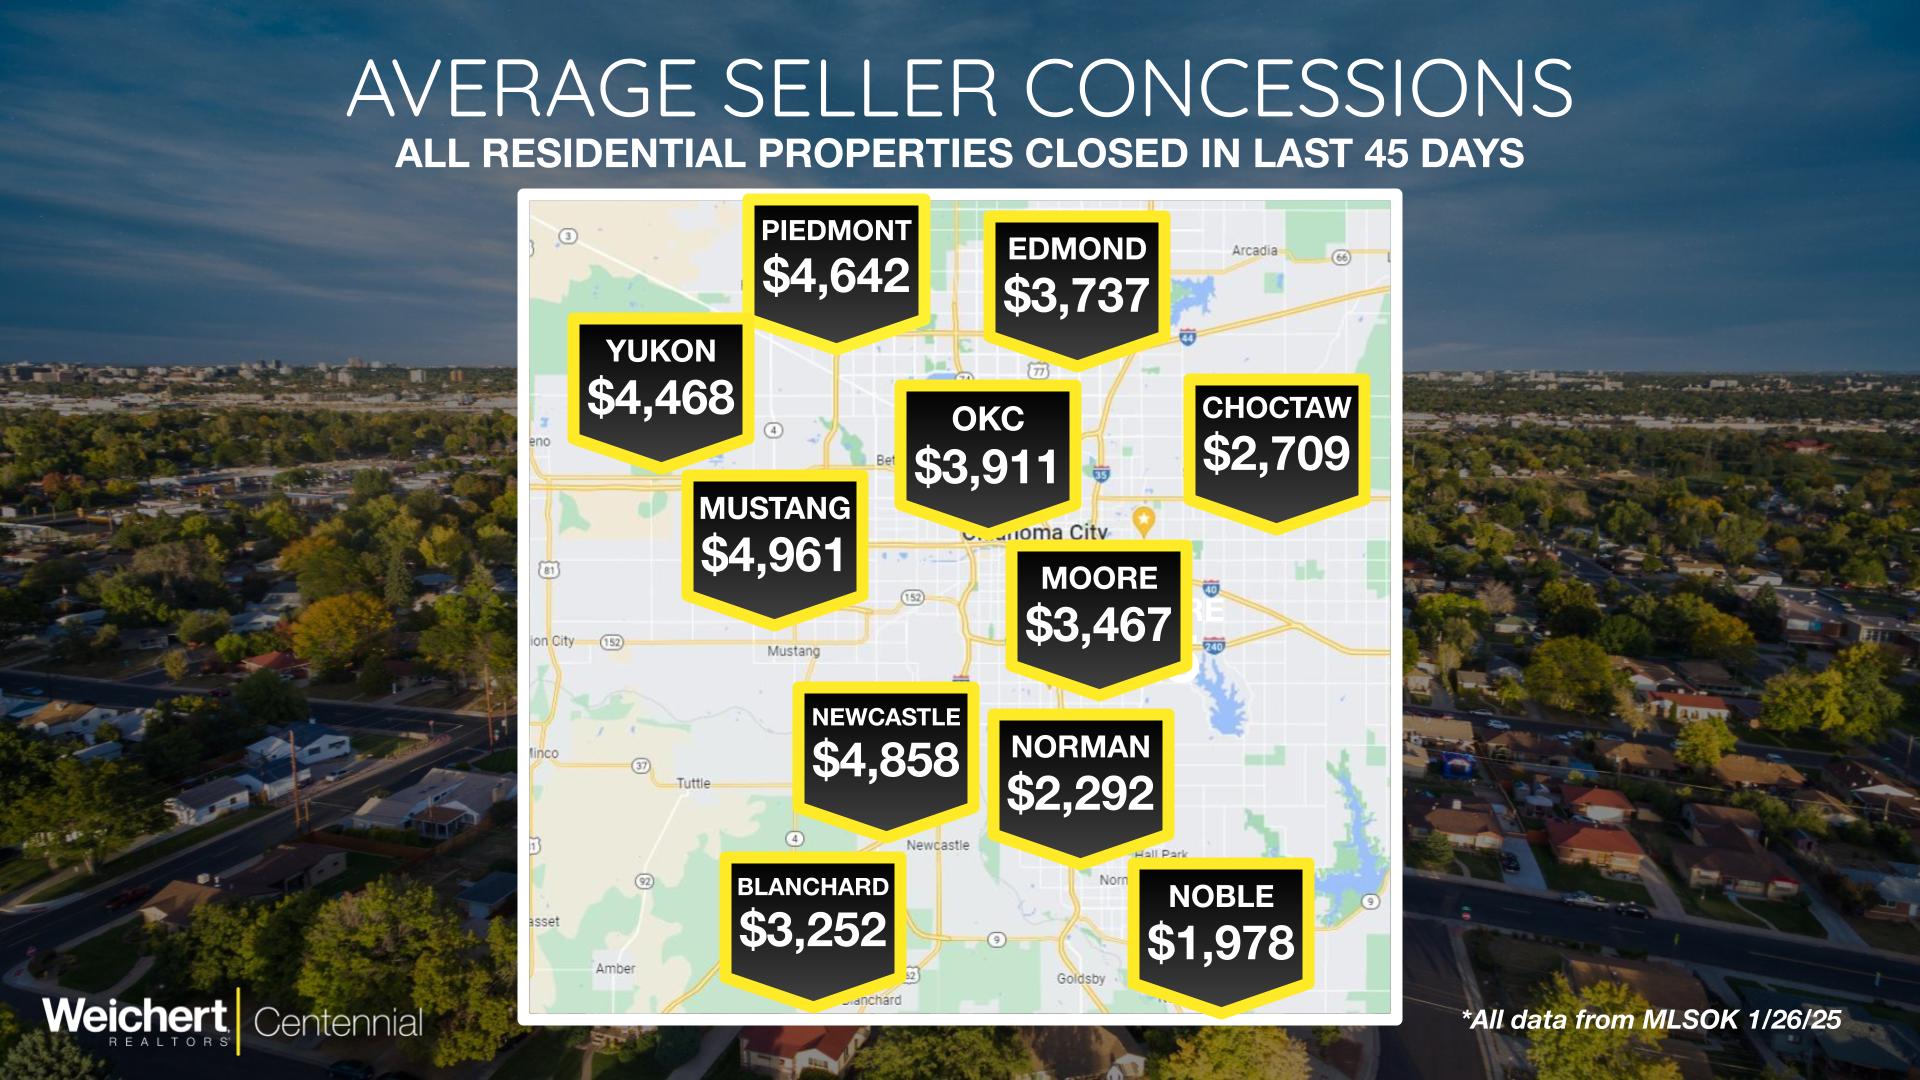
The first graph shows the average seller concessions in dollars over the last 45 days. This is the number that matters most emotionally because it’s tangible — it can be used to buy down an interest rate, cover closing costs, or offset repairs.
But here’s the key: higher dollar concessions don’t automatically mean a weak market. They often show up in areas where:
The price points are higher (so credits naturally scale up),
Buyers are more payment-sensitive (rate buy-downs matter more),
And sellers need to compete against similar inventory.
In other words, a market can still be active, but sellers may be using concessions as a tool to keep their home attractive without cutting the list price. That distinction matters, because price reductions can impact appraisal perceptions and neighborhood comps. Concessions are often the quieter way to get the deal done.
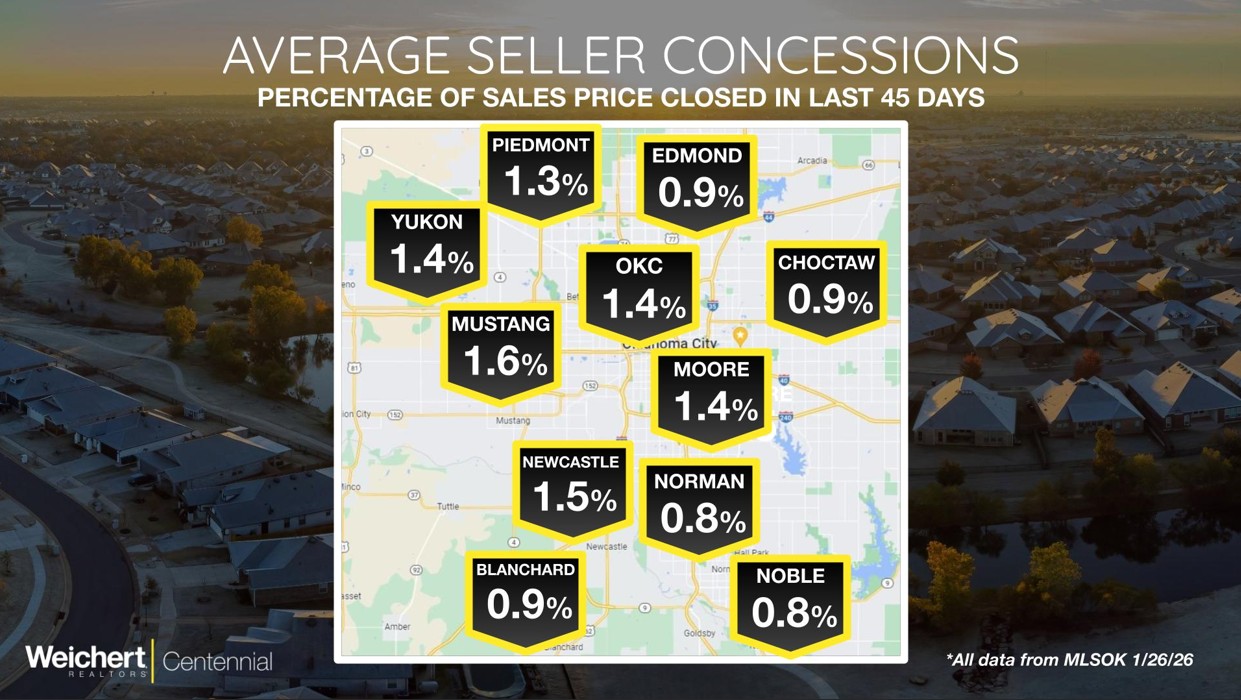
Dollar amounts can be misleading if you don’t adjust for price. That’s where the second graph helps: concessions as a percentage of sales price (last 45 days).
This view is powerful because it shows whether concessions are actually “large” in context.
What stands out in this graph is that concession percentages remain relatively tight across the metro. That tells us something important: the market isn’t suddenly handing out massive discounts everywhere. Instead, what we’re seeing is more like a consistent negotiating norm — a typical range of credits used to bridge affordability or inspection items.
This also explains why some areas can have big dollar credits but still not look extreme on the percentage chart. The market may be adjusting, but it’s doing it in a measured way.
Translation: concessions are becoming a standard lever — not a panic button.
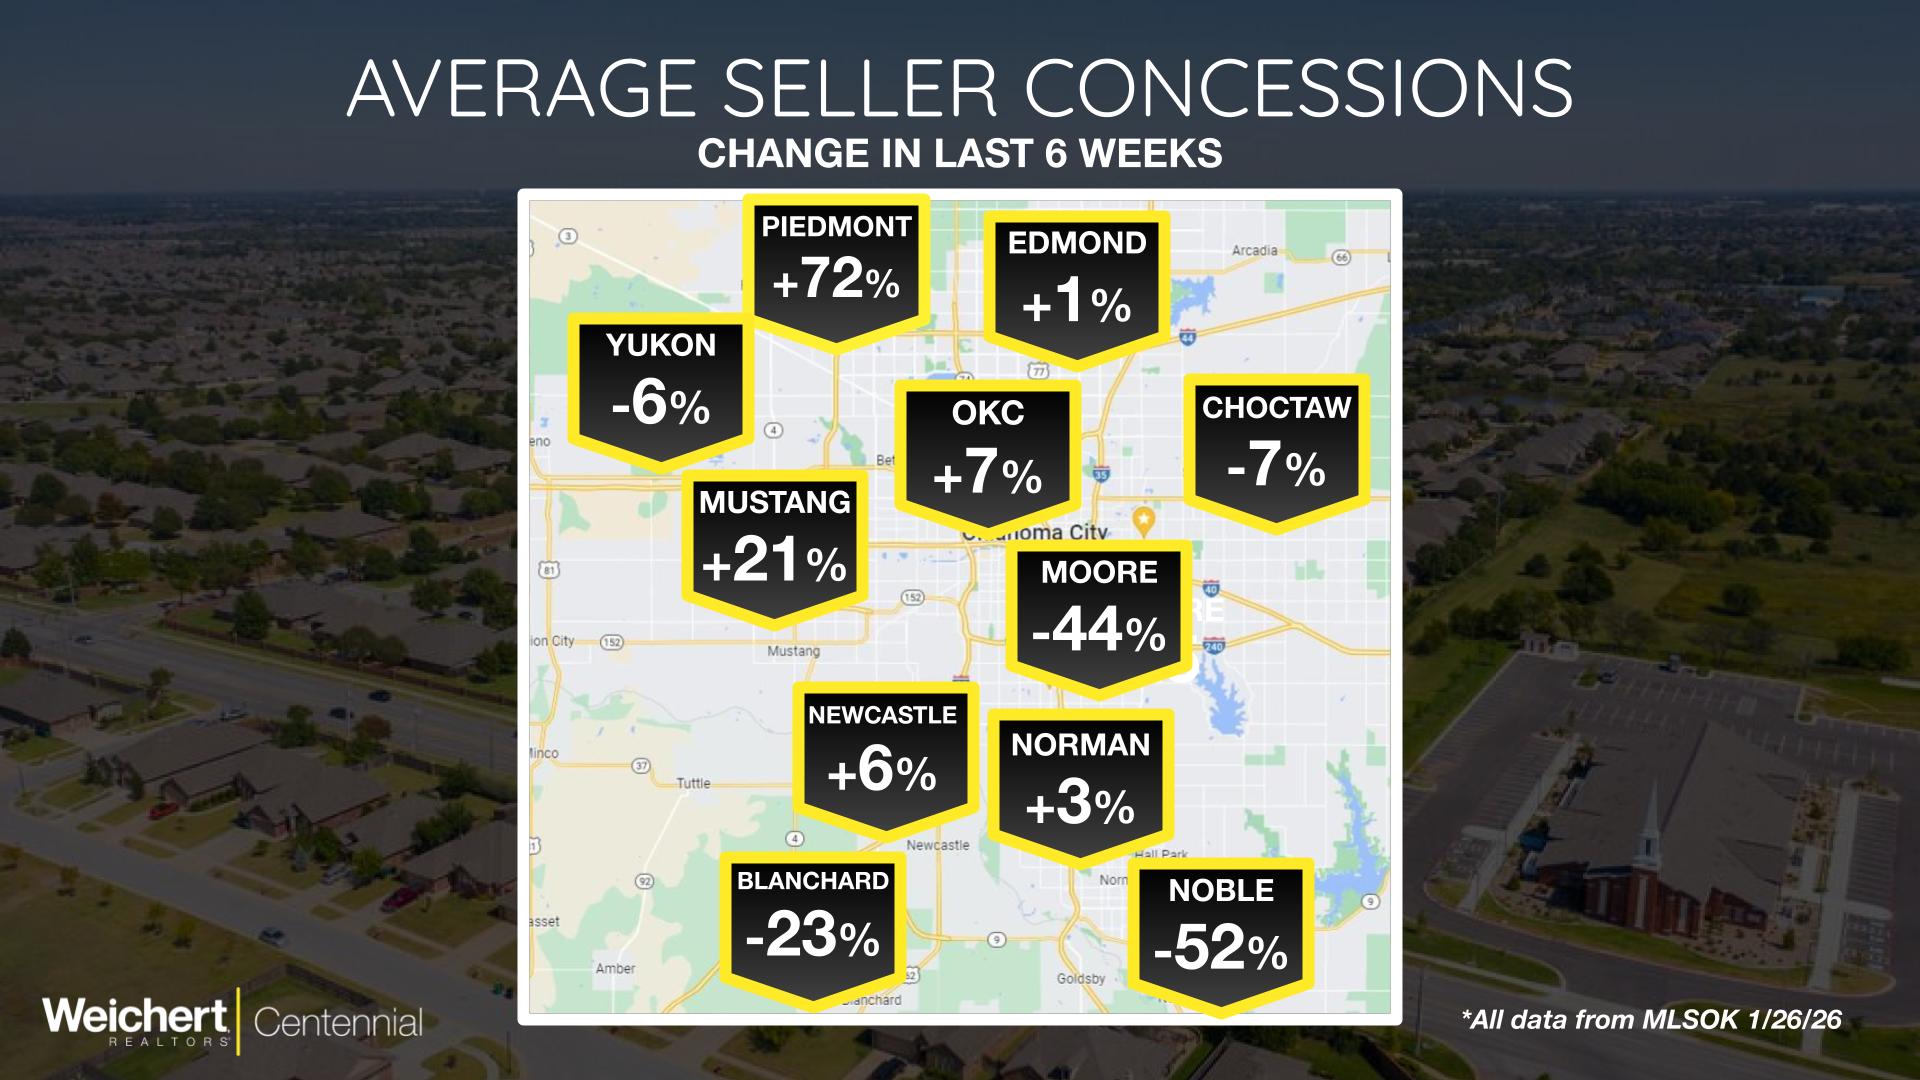
The third graph is the one most people should pay attention to: how seller concessions have changed over the last six weeks. This is your trend line — the “direction” of negotiation.
And this is where the story gets interesting.
When concessions rise quickly, it often means one (or more) of these is happening:
Inventory is building in that submarket,
Buyers are slowing down or getting pickier,
Days on market are stretching,
Or sellers overshot pricing and are now using credits to recover interest.
When concessions fall, it can indicate:
Better pricing accuracy,
Scarcer inventory for that location/price band,
Stronger demand,
Or homes that are simply moving faster — reducing the need for credits.
This change map is the best “market pulse” because it reveals where sellers have had to adjust their strategy recently, not just what’s happening in a static snapshot.
If you’re a buyer, concessions can be a huge opportunity — but only if you use them strategically.
A seller credit is often more valuable than a price cut when:
You can use it to buy down your rate,
You’re trying to preserve cash for moving/furnishing,
Or you want breathing room after inspections.
The biggest mistake buyers make is negotiating only on price. In this market, the smarter play is often to negotiate terms: credits, repairs, and financing support.
If you’re selling, concessions aren’t “bad.” They’re a tool — but they work best when they’re part of a plan.
The sellers who win are usually the ones who:
Price correctly from day one,
Present the home well (condition + photos + showing readiness),
And understand what their submarket is doing right now.
Sometimes a modest concession gets you to closing faster than a series of reductions that make buyers wonder what’s wrong.
These three graphs together show a market that’s still moving — but negotiating has become more normal and more strategic. Seller concessions aren’t simply giveaways; they’re how deals are being structured in a payment-sensitive environment.
If you want a clear takeaway: concessions are the new battleground for leverage, and the best results come from understanding your specific area and price range — not relying on national headlines.
If you’d like, I can also turn this into a version formatted for your website blog (with headings, SEO subheadlines, and a short meta description), or write a companion post that ties concessions to mortgage rates and days on market for an even sharper narrative.

Real estate is more than just buying and selling homes—it’s about helping people move forward in life. I pride myself on being a good listener and lifelong learner, always focused on under....
At first glance, the latest MLSOK numbers make the market look remarkably strong for sellers.Across nearly every featured OKC-area town, homes are selling for an average of 98% to 100% of list.
When most people look at the housing market, they focus on what just sold.Closed sales are useful, but they are also backward-looking. They tell us what buyers and sellers agreed to days or weeks.
 Copyright© 2026 MLSOK, Inc. listing content is believed to be accurate but is not guaranteed. Subject to verification by all parties. The listing information being provided is for consumers personal, non?commercial use and may not be used for any purpose other than to identify prospective properties consumers may be interested in purchasing. This listing data is copyrighted and may not be transmitted, retransmitted, copied, framed, repurposed, or altered in any way for any other site, individual
and/or purpose without the express written permission of MLSOK, Inc. Information last updated on September 22, 2026 5:26 PM UTC
© 2026 OKC Metropolitan Association of REALTORS® (OKMAR). All rights reserved.
Disclaimer: All information deemed reliable but not guaranteed and should be independently verified. All properties are subject to prior sale, change or withdrawal. Neither listing broker(s) nor September 22, 2026 5:26 PM UTC shall be responsible for any typographical errors, misinformation, misprints and shall be held totally harmless.
Data last updated on September 22, 2026 5:26 PM UTC
Show More...
Copyright© 2026 MLSOK, Inc. listing content is believed to be accurate but is not guaranteed. Subject to verification by all parties. The listing information being provided is for consumers personal, non?commercial use and may not be used for any purpose other than to identify prospective properties consumers may be interested in purchasing. This listing data is copyrighted and may not be transmitted, retransmitted, copied, framed, repurposed, or altered in any way for any other site, individual
and/or purpose without the express written permission of MLSOK, Inc. Information last updated on September 22, 2026 5:26 PM UTC
© 2026 OKC Metropolitan Association of REALTORS® (OKMAR). All rights reserved.
Disclaimer: All information deemed reliable but not guaranteed and should be independently verified. All properties are subject to prior sale, change or withdrawal. Neither listing broker(s) nor September 22, 2026 5:26 PM UTC shall be responsible for any typographical errors, misinformation, misprints and shall be held totally harmless.
Data last updated on September 22, 2026 5:26 PM UTC
Show More...
